Crucial Inflation Measure Moves Lower
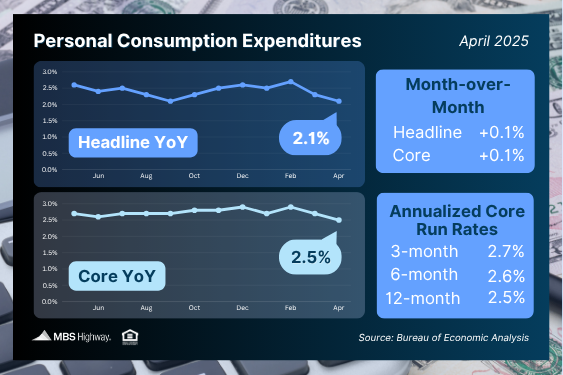
Good news on the inflation front! The latest Personal Consumption Expenditures (PCE) report shows headline inflation inched up just 0.1% month-over-month while dropping to 2.1% annually (down from 2.3%). Core PCE – the Fed’s preferred inflation gauge – fell to 2.5%, moving closer to their 2% target.
Shelter costs remain crucial for reaching the Fed’s 2% goal, representing 18% of Core PCE. While shelter costs remain elevated in government reports, real-time rental data from Zillow, Apartment List and CoreLogic shows softening trends. As PCE catches up to these actual rental conditions, inflation numbers should continue improving.
What’s the bottom line? While April’s annual inflation declined, further progress might be challenging until early 2026. Why? The monthly figures for core PCE from May through December 2024 that will drop out of the 12-month calculation are already relatively low (0.08% to 0.29%). Looking ahead, January and February 2025 figures (0.33% and 0.46%) provide higher comparisons, potentially making progress toward the Fed’s 2% target easier next year when these numbers are replaced.
Home Prices Show Steady Annual Growth
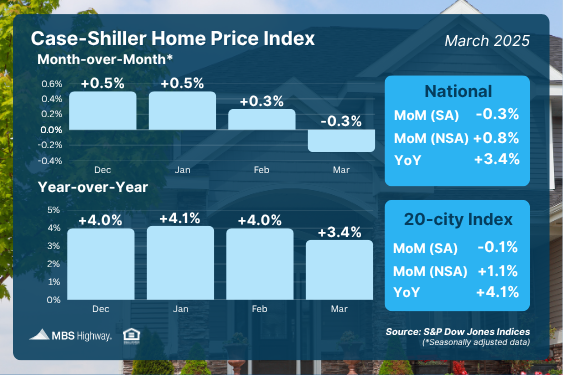
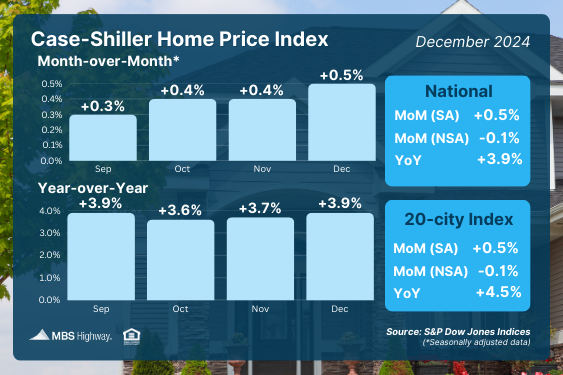
The latest Case-Shiller Home Price Index (widely considered the “gold standard” for tracking home values) reveals nationwide home prices rose 0.8% from February to March before seasonal adjustments, though they declined slightly (-0.3%) after adjustments. This difference occurs because prices typically increase during spring, so seasonal adjustments moderate these expected gains.
National home values increased 3.4% year-over-year in March, down from February’s 4% annual growth. Urban markets outperformed the national average, with the 10-city composite growing 4.8% and the 20-city index rising 4.1% compared to last year.
The FHFA House Price Index showed similar trends: prices increased 0.8% before seasonal adjustments but decreased 0.1% after adjustments, with a 3.7% year-over-year gain. Note that FHFA only tracks homes purchased with conventional mortgages, excluding cash purchases and jumbo loans.
What’s the bottom line? As Case-Shiller notes, “limited supply and steady demand drove prices higher across most metropolitan areas.” The consistent annual price growth demonstrates why homeownership remains a powerful wealth-building tool. For perspective: a $600,000 home appreciating at 4% annually builds $24,000 in equity in just one year – an impressive return on investment.
Pending Home Sales See Sharp Decline
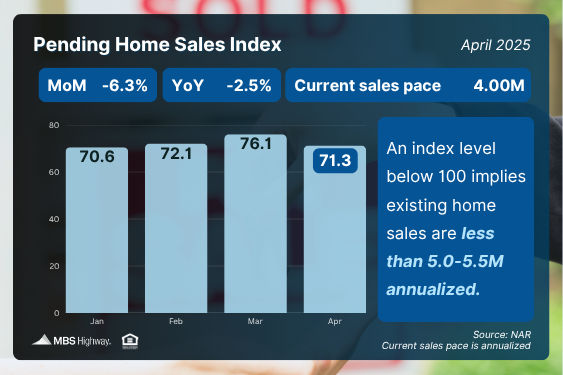
Following a strong March increase, Pending Home Sales fell 6.3% in April, according to the National Association of REALTORS® (NAR). This key housing market indicator tracks signed contracts on existing homes and typically forecasts closing activity in the next 1-2 months.
What’s the bottom line? Contract signings decreased across all four U.S. regions. NAR’s Chief Economist Lawrence Yun explained, “Despite an increase in housing inventory, we are not seeing higher home sales.” While inventory remains well below pre-pandemic levels, Yun noted the recent supply increase means “buyers in nearly every region of the country are in a better position to negotiate more favorable terms.”
Slight Improvement in First Quarter GDP
The second estimate for first quarter 2025 GDP shows the U.S. economy contracted by -0.2% – slightly better than the initially reported 0.3% decline.
What’s the bottom line? GDP serves as our economic health scorecard, and any slowdown raises concerns. The recent contraction primarily stemmed from higher imports (as businesses prepared for new tariffs) and decreased government spending. Since imports are produced elsewhere, they count against GDP calculations. On the positive side, growth in investment, consumer spending (though revised downward), and exports partially offset these factors.
Note: These figures may be adjusted when the final estimate is released on June 26.
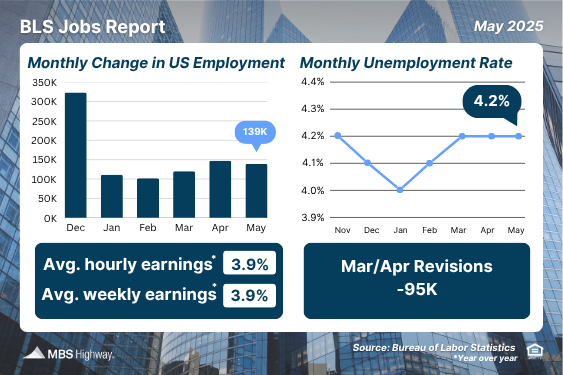
Continuing Unemployment Claims Reach Multi-Year High
Weekly initial jobless claims jumped by 14,000 to 240,000, hitting their highest mark since late April. Meanwhile, continuing unemployment claims increased by 26,000 to 1.919 million – a level not seen since November 2021.
What’s the bottom line? Continuing claims have remained stubbornly above 1.8 million weekly for the past year, exceeding 1.9 million twice in just the last five weeks. This pattern suggests job seekers are experiencing longer periods between employment. Companies have slowed their hiring as they navigate economic uncertainty and concerns about how potential tariff policies might impact their operations.
Family Hack of the Week
June is National Mango Month! Celebrate with this refreshing and easy No-churn Mango Ice Cream from Food Network– no ice cream maker required! Yields 4 servings.
Freeze 1/2 cup plain yogurt in an ice cube tray until solid (at least 2 hours or overnight). In a food processor, combine frozen yogurt cubes, 16 ounces (about 2 cups) frozen mango, 1 tablespoon honey, and a pinch of ground cardamom. Process until smooth, scraping down the sides as needed with a rubber spatula.
Transfer to an airtight container and freeze for about 1 hour until scoopable. Enjoy on its own or à la mode with your favorite cake!
What to Look for This Week
There’s a packed schedule of labor market reports. Look for job openings data on Tuesday, ADP private payroll figures on Wednesday, weekly jobless claims on Thursday, and the comprehensive jobs report (featuring non-farm payrolls and the unemployment rate) on Friday.
Technical Picture
Mortgage Bonds moved higher last Friday, breaking through two key resistance levels: the 25-day and 100-day Moving Averages. They finished last week trading in a tight range, with the 50-day Moving Average now acting as the new ceiling. Meanwhile, the 10-year Treasury yield closed below its 100-day Moving Average, with support at its 25-day Moving Average just beneath.